Summary of Craft Your Own Wireless Frequency Meter with Arduino: A DIY Guide
This article describes a wireless Arduino frequency meter designed to measure AC sinusoidal waveforms between 50Hz and 3kHz. The system uses separate transmitter and receiver modules communicating via 434MHz RF to enable remote monitoring without physical connections. The transmitter conditions the signal using diodes and an optocoupler, while the receiver utilizes an Arduino Uno to process data and display results on an LCD screen.
Parts used in the Wireless Frequency Meter:
- Arduino Uno
- AVR ATmega328P microcontroller
- Rectifier diodes
- MCT2E opto-coupler IC
- 16×2 LCD
- 434 MHz TX module
- 434 MHz RX module
- Bridge rectifier
This project details the development of a wireless Arduino frequency meter capable of determining the frequency of AC sinusoidal waveforms between 50Hz and 3kHz.
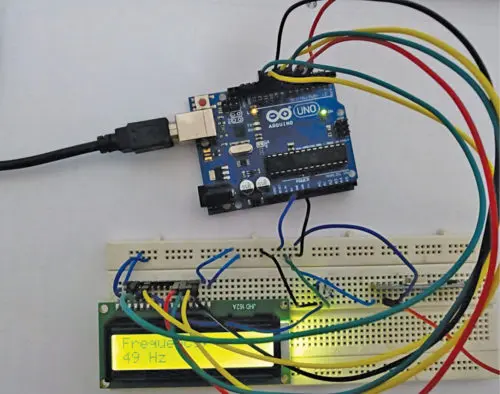
Figures 1 and 2 depict the prototype hardware constructed for the transmitting and receiving functions. Figure 1 shows the transmitting circuit board which incorporates the frequency sensing components. Figure 2 presents the receiver module containing the Arduino microcontroller used for digital processing and readout display.
Rather than relying on wired connection between sensing and analysis stages, these dual circuit boards communicate results wirelessly via RF transmission and reception. This permits remote monitoring of alternating current frequencies in hard to access locations.
The goal of designing dedicated transmit and receive devices was to create a portable frequency measurement solution. Equipped with its own power supply and radio modules, each half can operate independently yet still share data without physical tethering.
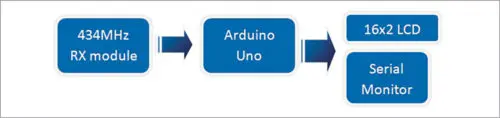
The block diagrams of the transmitter and receiver sides are shown in Figs 3 and 4, respectively.
Circuit and working
The main components used in the Wireless Frequency Meter project and their role is described below.
Arduino Uno
The Arduino Uno is utilized on the receiving end of this wireless frequency meter system. At the core of the Uno is an AVR ATmega328P microcontroller (MCU) which provides the processing capabilities.
Key specifications of this MCU include 32kB of ISP flash memory for program storage, 2kB of RAM for data, and 1kB of EEPROM. Additionally, it can operate at up to a 16MHz clock frequency.
The Uno board features six analog inputs and fourteen digital I/O pins that the MCU can interface with. It also supports various communication protocols like UART, SPI and I2C via its serial capabilities.
For this receiver application, digital I/O pin 5 is used as an input, connecting directly to the DATA pin of the 434MHz RF receiving module. Pins 7 through 12 on the Arduino then drive a 16×2 character LCD for displaying the measured frequency readings to the user.
By leveraging the I/O and processing power of the Arduino Uno, it serves as the centralized hub to wirelessly obtain frequency data and clearly display results.
Rectifier diodes
Specialized diodes transform the AC input signal into a pulsating DC signal on the transmitter side.
MCT2E
The MCT2E opto-coupler IC serves two crucial purposes: isolating the input stage from the subsequent stage and generating signals from the pulsating DC waveform on the transmitter side.
LCD
The 16×2 LCD, located at the receiver end, is responsible for displaying the frequency measurement. It is connected to the Arduino Uno board in 4-bit mode. The LCD’s pins RS, EN, D4, D5, D6, and D7 are linked to the Arduino’s digital I/O pins 12, 11, 7, 8, 9, and 10, respectively.
434 MHz TX-RX modules
The 434MHz transmitter (TX) and receiver (RX) modules serve as essential components for transmitting and receiving radio frequency (RF) signals between two devices. These modules operate at a carrier frequency of 434MHz, ensuring seamless communication.
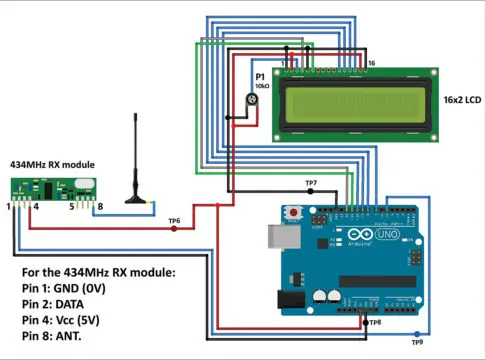
Figures 5 and 6 illustrate the circuit diagrams for the transmitter and receiver sides, respectively. These diagrams provide a clear visual representation of the electronic components and their connections.
In the realm of electronics, accurately measuring the frequency of signals is crucial for a wide range of applications. This guide delves into the construction of an Arduino-based wireless frequency meter, empowering you to measure frequencies with ease and precision.
Transmitter Side: Capturing and Processing the Signal
-
Signal Input: The signal whose frequency is to be measured is applied to the test signal input terminals (refer to Fig. 5). Ensure the signal is an alternating one and its amplitude does not exceed 10V peak-to-peak.
-
Bridge Rectifier: The bridge rectifier converts the alternating input signal into a pulsating DC signal.
-
Optocoupler: The pulsating DC signal is then fed to pin 1 of the MCT2E optocoupler. This optocoupler utilizes an internal LED to generate spikes, doubling the frequency of the input signal.
-
434 MHz TX: The frequency-doubled signal is finally directed to the DATA pin of the 434 MHz TX module.
Receiver Side: Decoding and Displaying the Measured Frequency
-
434 MHz RX: The 434 MHz RX module demodulates the received signal, extracting the frequency information.
-
Arduino Uno: The DATA pin of the 434 MHz RX is connected to digital I/O pin 5 of the Arduino Uno. The Arduino’s processing power is utilized to calculate the frequency of the test signal.
-
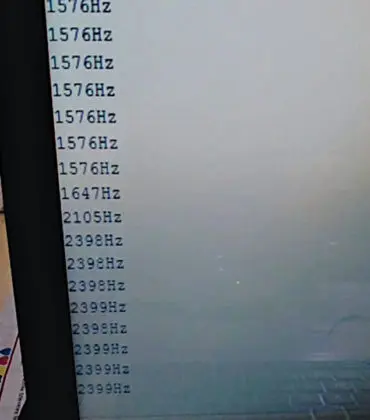
LCD and Serial Monitor: The calculated frequency is displayed on both the LCD and the serial monitor of the Arduino IDE. This provides a clear and convenient way to view the measured frequency.
With this Arduino-based wireless frequency meter, you can effectively measure frequencies with remarkable accuracy, expanding your capabilities in electronics exploration and experimentation.
This project can be used for experimenting, learning, testing and troubleshooting audio equipment in the audible range between 50Hz and 3kHz.
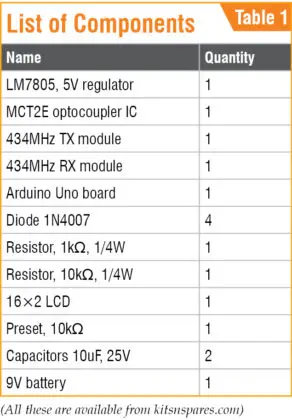
The components used in the project are listed in Table 1.
Software
The Arduino Integrated Development Environment (IDE) version 1.6.5 provides the interface for programming the Arduino Uno microcontroller board.
Within the IDE, the appropriate COM port and Arduino board model must be selected from the Tools menu. Next, the source code file named “freq_meter_wl_1.ino” is uploaded to the Uno board.
To view output, open the serial monitor from the same Tools menu. Set the baud rate to 9600 to establish communication and observe the frequency readings displayed in Hertz.
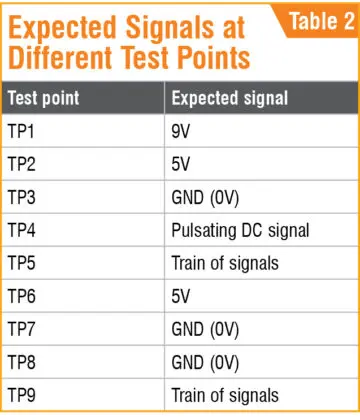
Should any issues arise, debugging can be assisted by validating voltages at marked test points on the schematic diagrams. Table 2 lists the expected voltage levels across different test points, serving as a reference during troubleshooting.
Calibrating signals at the test points as per the table allows tracing potential issues to specific sections of the circuit implementation. This aids rapid verification and refinement of the wireless frequency measurement design.
- What frequency range can this device measure?
The device determines the frequency of AC sinusoidal waveforms between 50Hz and 3kHz. - How does the transmitter side process the input signal?
A bridge rectifier converts the AC signal to pulsating DC, which is then fed to an MCT2E optocoupler that generates spikes doubling the frequency. - Which pins on the Arduino Uno are used for the RF receiver connection?
Digital I/O pin 5 is used as an input connecting directly to the DATA pin of the 434MHz RF receiving module. - Can the measurement be viewed on a computer?
Yes, the calculated frequency is displayed on both the LCD and the serial monitor of the Arduino IDE. - What baud rate should be set for the serial monitor?
The baud rate must be set to 9600 to establish communication and observe frequency readings. - What is the maximum amplitude allowed for the test signal?
The input signal amplitude should not exceed 10V peak-to-peak. - Which software version is recommended for programming the board?
The Arduino Integrated Development Environment version 1.6.5 provides the interface for programming the Arduino Uno. - How many digital I/O pins drive the LCD display?
Pins 7 through 12 on the Arduino drive the 16x2 character LCD for displaying measured frequency readings.