Summary of Arduino + Processing – 3D Sensor Data Visualisation
This article details a project to visualize 3D sensor data from a Sharp IR range finder using Arduino and Processing. The system employs two servos to pan and tilt the sensor, creating a grid of distance measurements. While initial attempts used a flat Cartesian grid, the author notes distortions in vertical objects and suggests converting coordinates or using a cylindrical arc shape for accurate 3D representation. The code averages multiple readings per position and transmits X, Y, and Z data via serial port for real-time visualization.
Parts used in the 3D Sensor Data Visualization:
- SRF05 Ultrasonic range finder or Sharp GP2Y0A02 IR sensor
- Arduino Deumilanove w/ ATMEGA328
- Breadboard / Prototyping board
- Jumper/ Connector wires
- 2x Servos (max 5v supply)
- C shaped Servo brackets
So following on from my previous posts about visualising sensor data in Processing, I’m now looking at drawing 3D representations of the data recorded from the Sharp IR sensor – although can be any kind of range finder.
I started by rigging 2 servos, one to pan left to right, the other up to down. The latter is limited to only 60 degrees of movement. I’m going to represent each servo position in a grid to start with, so a grid 180 wide (x) by 60 tall (y). The distance measured from the sensor will form the z index position so how far/ close a point will appear.
The setup is pretty much the same, Arduino records and sends the sensor data to the serial port buffer along with the X and Y position of the servos. Processing then picks this up and populates an array. Now this time I’m using multi-dimensional arrays, that is one array that stores other arrays. I could make just one array of 10800 items (180 * 60) but its far more efficient to make an array of 180 items, each item being another array of 60 items to store the distance measured. So for every 1 degree I move left to right, I record the 60 positions of the up/ down servo and the reading taken.
To visualise this I started drawing squares using the QUAD_STRIP shape to produce a grid layout (image at the top of the post). Of course because I’m actually using polar co-ordinates (degrees) instead of cartesian (x, y) then what the sensor is reading can’t really be translated to a flat grid. Because when it measures something vertical the measurements will all be different and when translated to my flat grid, it would make anything vertical look slanted. Trouble is now we’re trying to view something in 3D space so it doesn’t look all that great – so I’ve added in some animation to rotate the object slightly, looks fine when you zoom in close enough to one section but otherwise it’s just a random shape.
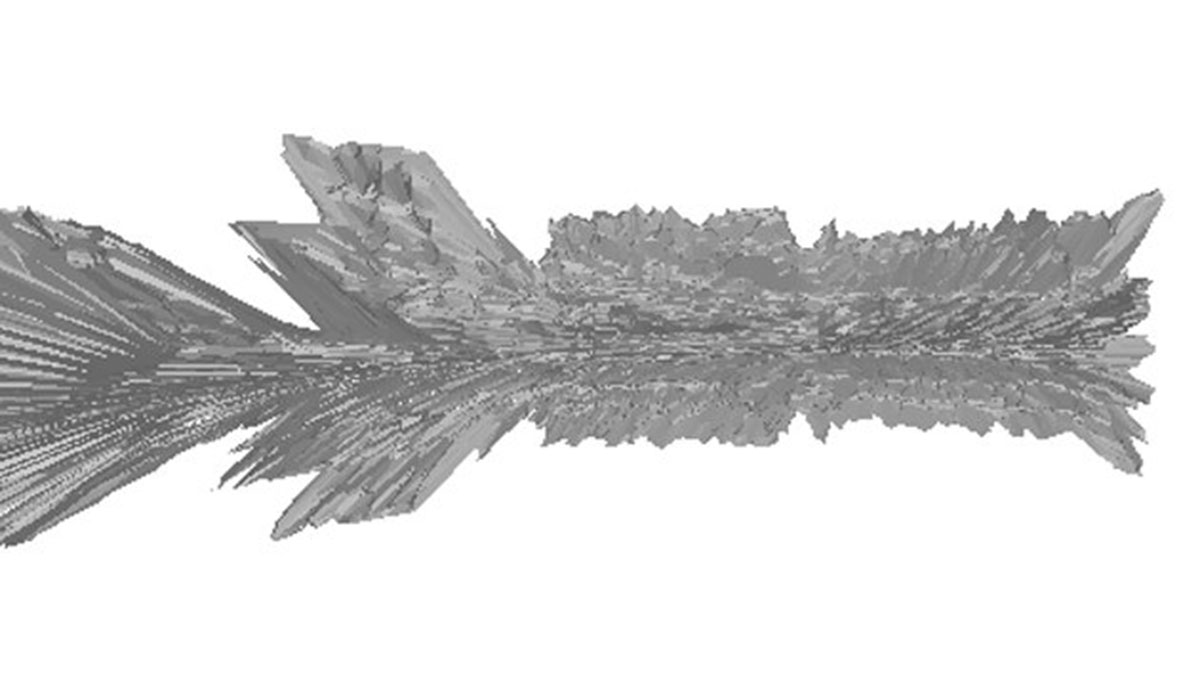
There are 2 ways around this, firstly we can convert our co-ordinates to cartesian. Or we can alter the grid used to display our data, the shape needed is basically a 60 degree arc thats lathed 180 degrees – so it kind of looks like a tyre wall. The radius used to draw our 60 degree arc is calculated by the distance taken from the sensor.
Arduino 3D Sensor Data Parts
SRF05 Ultrasonic range finder or Sharp GP2Y0A02 IR sensor (basically any kind of distance sensor)
Arduino Deumilanove w/ ATMEGA328
Breadboard / Prototyping board
Jumper/ Connector wires
2x Servos (has to need no more than 5v supply)
C shaped Servo brackets (If anyone can make these cheap enough let me know!)
Arduino 3D Plotter Circuit
Using the below posts you should be able to figure out how to wire the sensor and how to use the servos. I use digital pins 9 and 10 for the servos and analog pin 1 for the sensor reading.
Arduino SRF-05 Tutorials
Arduino Servo Tutorials
How to use the Sharp IR range finder
Arduino Sketch
We use the servo libary and a couple of FOR loops to control 2 servos, for every degree panned we tilt the other servo through 60 degrees taking a series of sensor readings for each position and averaging them. We output these values with the X and Y position in degrees to the serial port buffer. At the end of each loop we reset the servo position. If the sensor reading is outside the range of operation of the servo we also handle this.
/*
luckylarry.co.uk
3D Scan Visualisation for Sharp GP2Y0A02 IR range finder
Sends sensor readings for every degree moved by the servo
values sent to serial port to be picked up by Processing
*/
#include             // include the standard servo library
Servo leftRightServo;         // set a variable to map the servo
Servo upDownServo;
int leftRightPos = 0;         // set a variable to store the servo position
int upDownPos = 0;
const int numReadings = 10;   // set a variable for the number of readings to take
int index = 0;                // the index of the current reading
float total = 0;              // the total of all readings must be a float to allow totaling of float values
int average = 0;              // the average
int IRpin = 1;                // analog pin for reading the IR sensor

/* setup the pins, servo and serial port */
void setup() {
  leftRightServo.attach(9);
  upDownServo.attach(10);
  // initialize the serial port:
  Serial.begin(9600);
}

/* begin rotating the servo and getting sensor values */
void loop() {
 for(leftRightPos = 0; leftRightPos < 180; leftRightPos++)
  {
    leftRightServo.write(leftRightPos);

  for(upDownPos = 60; upDownPos < 120; upDownPos++)
  {
    upDownServo.write(upDownPos);

      for (index = 0; index<=numReadings;index++) {            // take x number of readings from the sensor and average them
        float volts = analogRead(IRpin)*0.0048828125;   // value from sensor * (5/1024) - if running 3.3.volts then change 5 to 3.3
        float distance = 65*pow(volts, -1.10);          // worked out from graph 65 = theretical distance / (1/Volts)S - luckylarry.co.uk
        total = total + distance;                              // update total
        delayMicroseconds(20);
      }
    average = (int) total/numReadings;                               // create average reading
        if (average < 20) {
         average = 20;
        }
        if (average > 150) {
         average = 150;
        }
        //average = 0 - average;
    if (index >= numReadings)  {                               // reset the counts when at the last item of the array
      index = 0;
      total = 0;
    }

Serial.print("Y");
Serial.print(upDownPos-60);
Serial.print("X");
Serial.print(leftRightPos);
Serial.print("Z");
Serial.println(average);

  }
    upDownServo.write(60);
  }

    leftRightServo.write(0);

}
For more detail: Arduino + Processing – 3D Sensor Data Visualisation
- How does the system represent distance in the 3D space?
The distance measured from the sensor forms the z index position to determine how far or close a point appears. - What type of array structure is used to store the data efficiently?
The project uses multi-dimensional arrays where one array stores other arrays to hold distance measurements for each servo position. - Why did the initial flat grid visualization fail for vertical objects?
Using polar coordinates on a flat grid causes vertical measurements to appear slanted because they cannot be accurately translated to a flat plane. - What alternative shape is suggested for displaying the data correctly?
The author suggests altering the grid to a 60-degree arc lathed 180 degrees, resembling a tyre wall. - Which digital pins are used to control the servos?
Digital pins 9 and 10 are used to connect and control the servos. - How many sensor readings are averaged for each position?
The code takes ten readings (numReadings = 10) and calculates an average for every degree moved. - What is the maximum distance value allowed in the code?
The code sets a limit where any average reading greater than 150 is capped at 150. - Can this project work with sensors other than the Sharp IR sensor?
Yes, the text states that any kind of range finder can be used as long as it provides distance data.