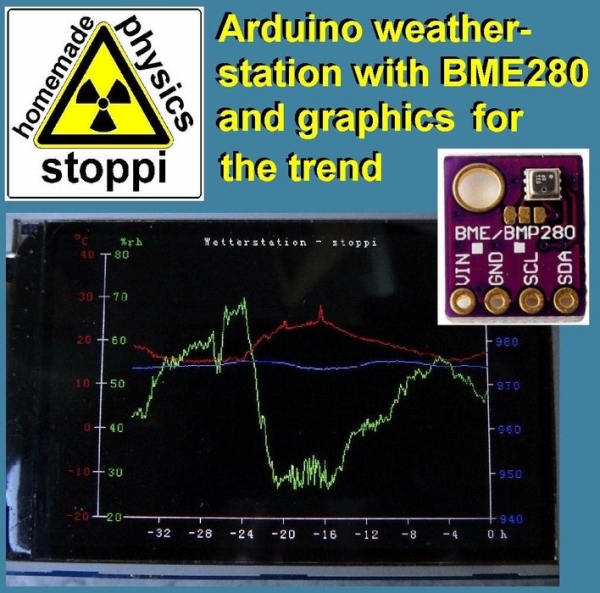
Summary of Weather-station With Arduino, BME280 & Display for Seeing the Trend Within the Last 1-2 Days
This article details a DIY weather station using an Arduino Mega and BME280 sensor to graphically display air pressure, temperature, and humidity trends over the last 1.5 days. By updating values every six minutes on a 320x480 display, users can visually identify weather patterns and relationships between variables like temperature and humidity. The project emphasizes fixed scales for easier long-term assessment of atmospheric changes.
Parts used in the Weather-station With Arduino, BME280 & Display for Seeing the Trend Within the Last 1-2 Days:
- Arduino mega
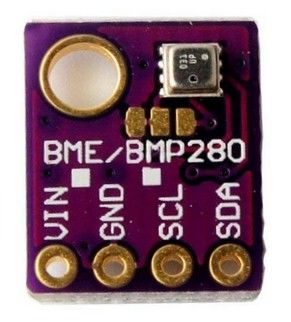
- Weather sensor BME280
- 320x480 pixel display for the Arduino Mega
- + 9V power supply
- Electric wire
Here on instructables weather stations have already been introduced. They show the current air pressure, temperature and humidity. What they lacked so far was a presentation of the course within the last 1-2 days. This process would have the advantage that you can not only graphically read the current values but also at a glance, see how they have changed in the last 1-2 days. As a result, one recognizes, for example, a possible change in weather, as the air pressure changes greatly. However, one also recognizes general relationships between the measured quantities.
For example, the humidity decreases when the air temperature rises. This is because warm air can absorb more humidity than cold air. If the relative humidity is about 60% at 20 ° C, then at 25 ° C the air could absorb more humidity in absolute terms. Therefore, the relative humidity is no longer 60%, but for example, only 50% off.
Also you can see nicely what time of day the highest or lowest temperatures are to be expected. Or that the humidity rises sharply when it rains. Ideal for the hobby meteorologist. I’d be very happy if you could post your experiences in the comments.
Step 1: Parts
For this weather station you only need 5 parts:
* Arduino mega: ebay arduino mega
* Weather sensor BME280: ebay BME280
* 320×480 pixel display for the Arduino Mega: ebay 320×480 display
* + 9V power supply: ebay power supply
* Electric wire
The total costs are only less than $25.
Step 2: The Arduino Code
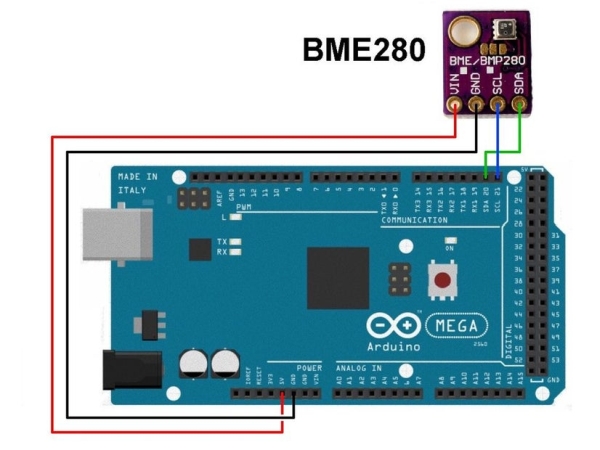
The circuit is very simple. You just have to connect the sensor to the arduino mega at this way:
Vin –> +5V
GND –> GND
SDA –> pin 20
SCL –> pin 21
The display is only plugged into the connector strip on the arduino mega.
Here are the links for the arduino-libraries you’ll need:
BME280-library: https://github.com/adafruit/Adafruit_BME280_Libra…
common sensor-library: https://github.com/adafruit/Adafruit_Sensor
The heart of this weather station is, as I said, the graphical representation of the weather data. At the moment, the values are updated every 6 minutes and the graphs are shifted 1 pixel to the left. In this way, the last 1.5 days can be recorded. Of course this can be changed at any time. Only then the value 360000 ms (= 6 minutes) and of course the time axis in hours must be changed. Here are the lines you’ll have to change:
time_neu = millis();
if(time_neu < time_alt) // to avoid problems after the millis-overflow
{
time_next = 0 + 360000;
}
if(time_neu > time_next && time_next >= 360000) // new measurement after 6 minutes
{
…
I have decided to keep the temperature, air pressure and humidity scales unchanged, as it allows you to quickly assess, over time, whether the air pressure is high, medium or low, based on the location of the current readings. If I would adjust the scale again and again, I would not recognize this at first glance. The time axis is located at the position y = 290 pixels. The marks on the y-axes are 45 pixels apart. If you want to display the air pressure from 940 mbar to 1000 mbar in 10 mbar steps, proceed as follows:
First, set up the general equation y = k * x + d. Now you use those 2 value pairs (x = 940, y = 290) and (x = 950, y = 245). This gives 2 equations with the two unknowns k and d: 290 = k * 940 + d and 245 = k * 950 + d. By subtracting both equations, we get: 290 – 245 = k * 940 – k * 950 + d – d. The unknown d vanishes in this way and we obtain for k = – 45/10 = -4.5. This value for k is placed in one of the two initial equations: 290 = -4.5 * 940 + d. In this way one obtains the value for d, specifically d = 4520.
If you want the air pressure, for example represent only 955 mbar to 985 mbar, you put the value pairs (955, 290) and (960, 245) in the straight-line equation. Then one obtains for k = -9 and d = 8885. Similarly, one calculates the straight-line equations for the temperature and the air humidity. These 3 equations appear here in the program:
for (i = 0; i <= 348; i ++)
{
if (humidity [i]! = -66)
{
myGLCD.setColor (255,0,0);
//myGLCD.drawPixel(81 + i, -4.5 * temperature [i] + 200);
myGLCD.drawLine (81 + i, -4.5 * temperature [i] + 200.81 + i + 1, -4.5 * temperature [i + 1] + 200);
myGLCD.setColor (0,255,0);
//myGLCD.drawPixel(81 + i, -4.5 * humidity [i] + 380);
myGLCD.drawLine (81 + i, -4.5 * humidity [i] + 380.81 + i + 1, -4.5 * humidity [i + 1] + 380);
myGLCD.setColor (0,0,255);
//myGLCD.drawPixel(81 + i, -4.5 * pressure [i] + 4520);
myGLCD.drawLine (81 + i, -9.0 * pressure [i] + 8885,81 + i + 1, -9.0 * pressure [i + 1] + 8885);
}
}
Step 3: The Results
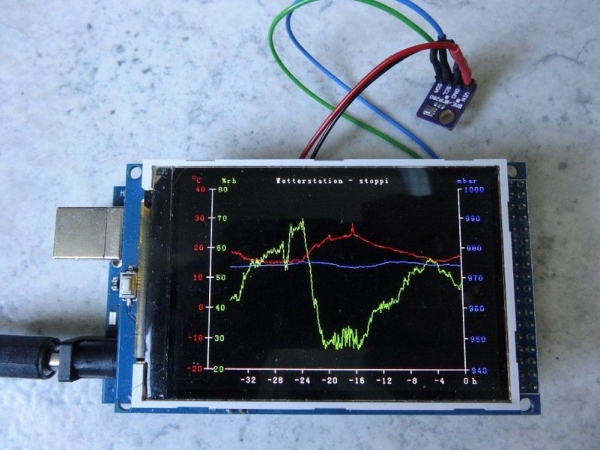
One word to the video: To make the expansion of the graph visible I decreased the time-steps down to 1 second. Therefore the display is strongly flickering. In reality the time-steps are 6 minutes. So you can’t see any flickering…
I would be glad if one or the other hobby meteorologist tries to tinker my weather station. A comparison with official measuring stations (f.e. University of Graz/austria) shows the usability of the measuring curves.
Furthermore, I would be happy if you could vote for me in the sensor contest and for my other instructables in the classroom science contest:
- https://www.instructables.com/id/DIY-LED-photomete…
- https://www.instructables.com/id/DIY-Wind-Tunnel-a…
- https://www.instructables.com/id/Simple-Autorange-…
Thanks a lot for this.
If you are interested in more physics projects, here is my youtube channel: https://www.youtube.com/user/stopperl16/videos
In this sense, Eureka …
Source: Weather-station With Arduino, BME280 & Display for Seeing the Trend Within the Last 1-2 Days
- How does the system visualize weather trends?
The system updates values every 6 minutes and shifts graphs 1 pixel left to record data from the last 1.5 days. - Can the update time interval be changed?
Yes, the value 360000 ms (6 minutes) and the time axis in hours can be modified in the code. - Why are the temperature, air pressure, and humidity scales kept unchanged?
Fixed scales allow users to quickly assess if readings are high, medium, or low based on location without constant recalibration. - What is the cost of building this weather station?
The total costs are less than $25. - How does rising air temperature affect relative humidity?
When air temperature rises, warm air absorbs more humidity, causing the relative humidity percentage to decrease even if absolute humidity remains constant. - Where is the time axis located on the display?
The time axis is located at the position y = 290 pixels. - Does the display flicker during normal operation?
No, flickering only occurs in the video demonstration where time steps were reduced to 1 second; reality uses 6-minute steps. - Which libraries are required for the Arduino code?
The project requires the Adafruit_BME280_Library and the common Adafruit_Sensor library.