Summary of Real-Time Energy Monitor with Arduino and LabVIEW using arduino
This article describes a non-invasive Real-Time Energy Monitor project using Arduino. The system detects house current consumption by counting pulses from the red LED on a home energy meter via a photoresistor. Data is transmitted wirelessly via XBee to a PC running LabVIEW, which displays real-time and 5-minute average consumption metrics.
Parts used in the Real-Time Energy Monitor:
- Arduino board
- Photoresistor
- Black tape
- Resistive divider components
- Potentiometer
- XBee module (transmitter)
- USB/XBee module (receiver)
- PC with LabVIEW software
We present the candidature of Mr. Michele Mancini for the TiDiGino Contest. He proposes us a recent application with Arduino: Real-Time Energy Monitor
This is a simple power meter to analize the current consuming in a house using the led indicator of a house energy meter.
Reading the red led of a home energy counters the system detects the corrent consumption in a house.
It is a noninvasive method, not cut wire, no current disconnects, so a very interesting method…
The system consists of two parts: the Arduino board that detects the led pulses and sends the data via the XBee module, and a PC that recive the data through a USB/Xbee module and processes the data with LabVIEW so you can prepare and study the consumption in a very instant.
Arduino sends two datas to the PC:
1 – Real time datas
2 – Average consumption measured in a time of 5 minutes.
From the picture we see that the LED that indicates the current consumption is the red LED near to the display. In particular is the LED superior.
Arduino module
To detect the LED blinking you have to apply a simple photoresistor above the led and covered it with black tape. To read the analog voltage using the Arduino you have to use a resistive divider as shown in diagram:
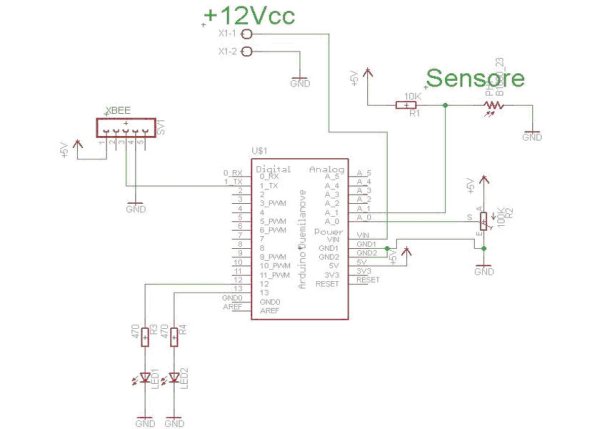
The LED blinking causes the voltage drop down and this value is read by Arduino and compared with the voltage acquired by the potentiometer connected in the channel A0. This potentiometer has the task to adjust the sensitivity threshold.
The read data are processed from the sketch and then sends to the PC via Xbee module.
The Arduino code acquisition is as follows:
For more detail: Real-Time Energy Monitor with Arduino and LabVIEW
- How does the system detect current consumption?
The system counts pulses from the red LED of the home energy meter using a photoresistor. - Can this method cut wires or disconnect current?
No, it is a noninvasive method that requires no wire cutting or current disconnection. - What data does the Arduino send to the PC?
The Arduino sends real-time data and average consumption measured over a time of 5 minutes. - How is the sensitivity threshold adjusted?
A potentiometer connected to channel A0 adjusts the sensitivity threshold for voltage comparison. - Which LED indicates current consumption?
The superior red LED near the display on the energy counter indicates current consumption. - What software processes the received data?
LabVIEW software on the PC receives and processes the data sent via the USB/Xbee module. - How is the photoresistor positioned?
The photoresistor is applied above the LED and covered with black tape. - Does the system measure instantaneous consumption?
Yes, the system allows you to prepare and study consumption in a very instant.