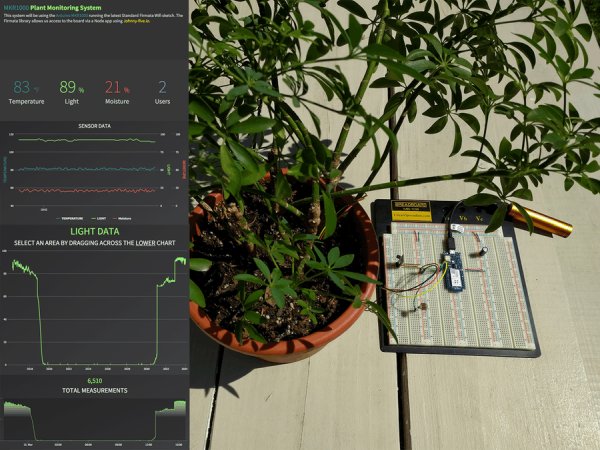
Real time plant monitoring system to view temperature, light exposure and moisture.
Things used in this project
Story
This is a simple plant monitoring system made using the MKR1000, Standard Firmata Wifi sketch along with Johnny-Five and Node.
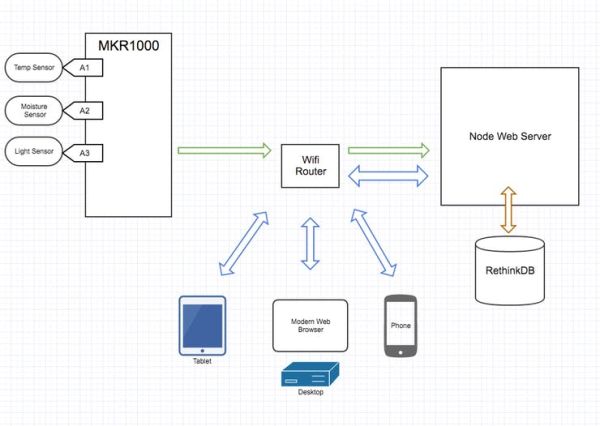
I started off by loading the MKR1000 with the StandardFirmataWifi sketch. This will allow us to communicate with the board using Johnny-Five.
- Open Arduino IDE
- File -> Examples -> Firmata -> StandardFirmataWifi
- Switch to the 2nd tab ‘wifiConfig.h’
- Read the comments and set options to match your device. For the MKR1000 I had to comment out Step 1 option A and uncomment option B. Then scroll down and configure you SSID and password for your wifi. You can set your ip address for the board to be static if needed. Below are the lines in wifiConfig.h that I had to change for my home wifi setup.
//#define ARDUINO_WIFI_SHIELD
#define WIFI_101
char ssid[] = "Wish I had Google Fiber";
#define STATIC_IP_ADDRESS 192,168,1,9
#define SERVER_PORT 3030
char wpa_passphrase[] = "mkr1000wifi";
- Switch back to the first tab ‘StandardFirmataWifi’
- Compile and Upload sketch to MKR1000
Next, I created a web app using node and express. This will allow us to run Johnny-Five, an open source Firmata protocol based framework, allowing for easy communication between the MKR1000 and my node app.
Then, I created a basic dashboard where users can view the current sensor data that is being streamed from the MKR1000 to the client in real time. I’m using WebSockets to emit the sensor data to the clients every second.
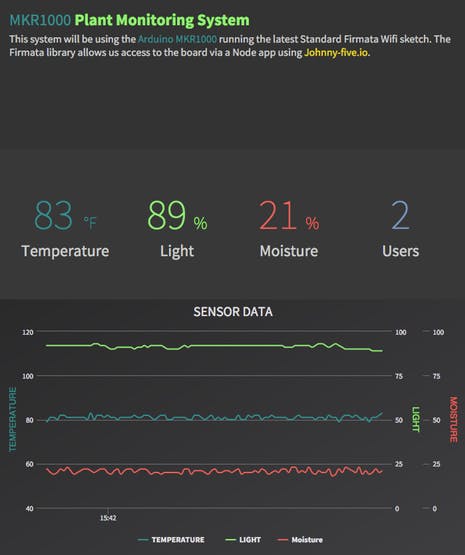
The user may also click through on any of the sensor readings to view the complete history for that particular sensor. This view renders 2 graphs, the top graph being a zoomed in version of the total readings, and the bottom graph is the complete historical data for that sensor. The user can select a range on the bottom graph which updates the top ‘detailed’ graph for the selected range. These charts display data that is saved to a RethinkDB every 10 seconds.
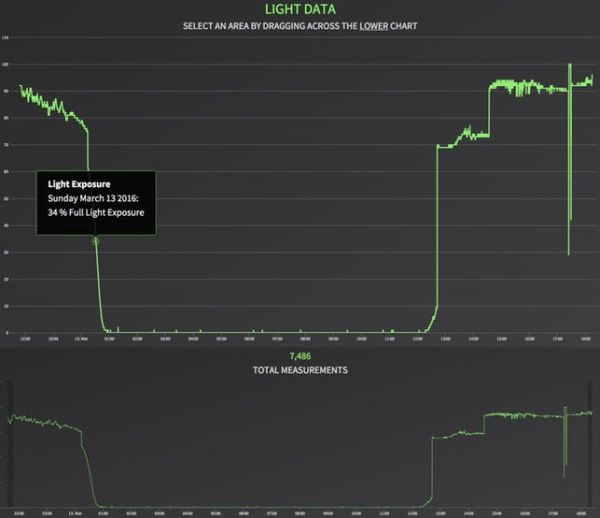
You will need to install RethinkDB and run it locally. They have some great docs so check them out at
https://rethinkdb.com/docs/install/
Once you get RethinkDB installed, we will need to create a database and table to store our measurements mentioned earlier.
- open up the terminal and type
rethinkdbto start our rethinkdb server.
- then open any modern browser and go to
localhost:8080
This will load the RethinkDB dashboard where you can access your database and create tables. For this system, we will need to create a database named plant_monitoring_system and a table named measurements
- Click Tables to load the tables view
- Click ‘+ Add Database’ button
- Type
plant_monitoring_systemand click Add
Then, click on ‘Data Explorer’ to open up the data explorer where we will run our commands to create the table needed for this project. Type the following code inside the Data Explorer and click run.
r.db('plant_monitoring_system').tableCreate('measurements')
That should do it for the database creation. We just need to make sure that the database is running before we start our node app. We started our database earlier with the command
rethinkdb
so we should be good to go.
Here is short video explaining the whole process.
Here is a LONG video of me doing the full software installation.
Here are some photos of the setup.
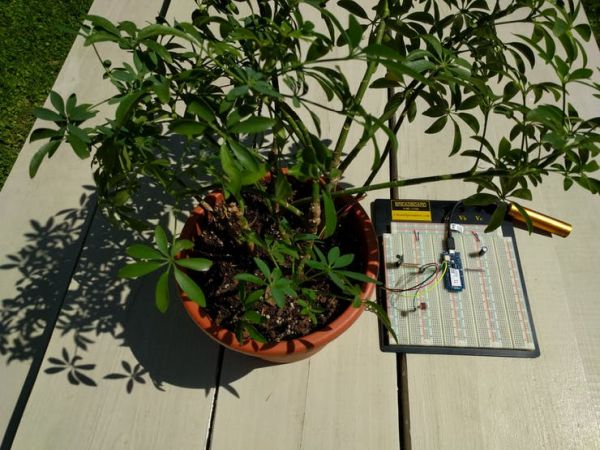
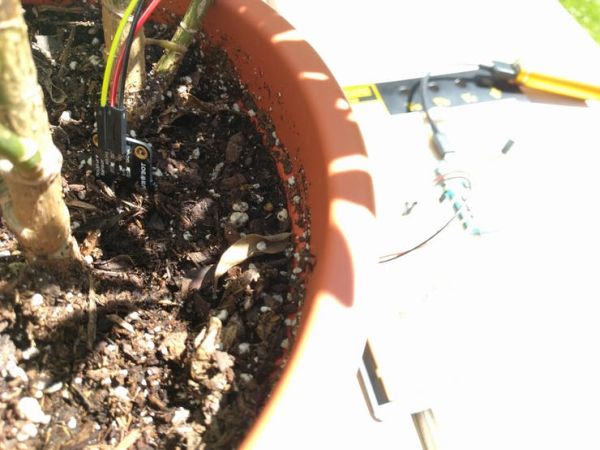
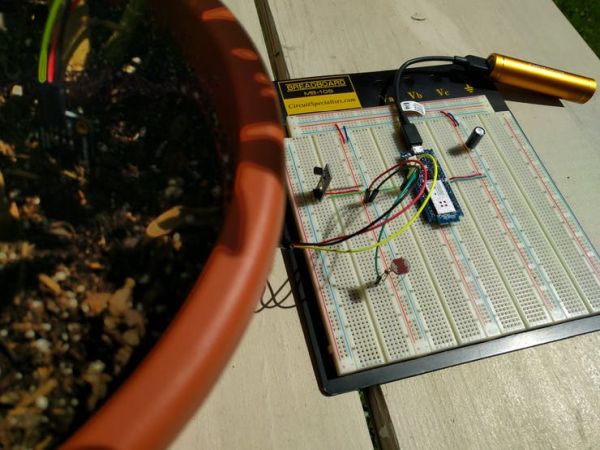
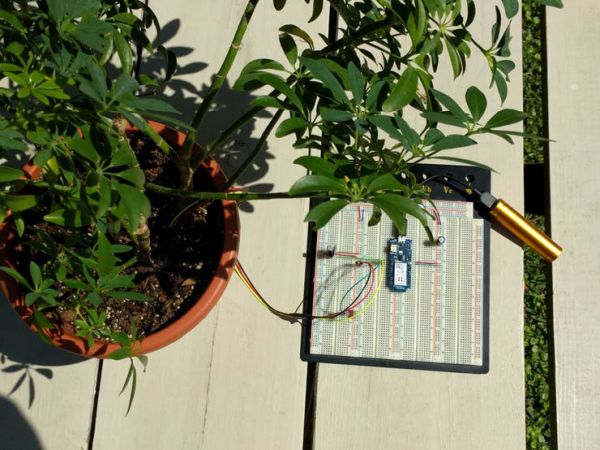 Overview.
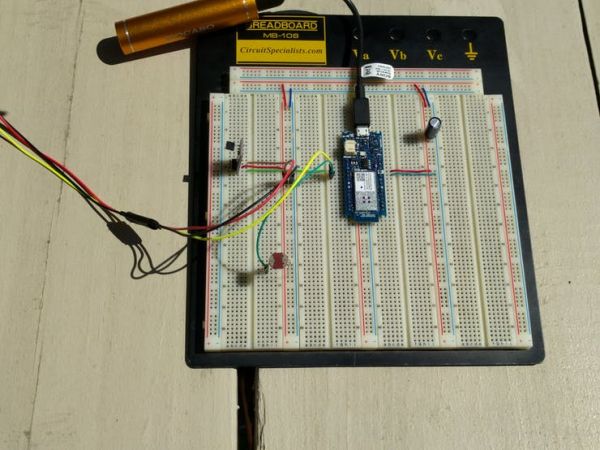
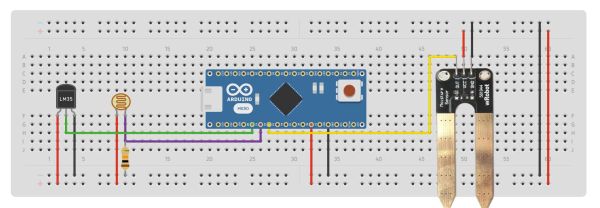
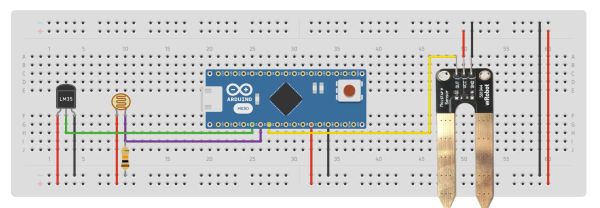
Below is a schematic of the circuit I built for this system. The board is really an Arduino MKR1000. The 5v pin is really 3.3v but all components will work fine with 5v.
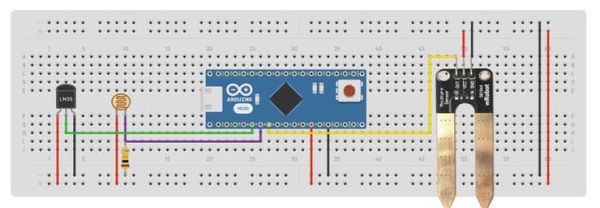
Its hard to see in the photo, but you simply connect the following sensors to their respected ports.
LM35 sensor is connected:
- 3.3v
- Analog Pin 1
- Ground
Photoresistor is connected:
- 3.3v
- Analog Pin 2 & 10k Ohm Resistor to Ground
Moisture sensor is connected:
- Analog Pin 1
- 3.3v
- Ground
Schematics
Code
Source : Plant Monitoring System

