Sometimes when you’re testing a sensor or debugging a value in an Arduino project, you want to see something other than numbers flying by in the Serial Monitor. However, you want to get the sensor working quickly, and you don’t want to take the time to write code to graph it or display it in an intricate way.
Well, we can fix that 🙂
The trick is very simple. However it graphs it sideways, but hey, it’s quick and easy.
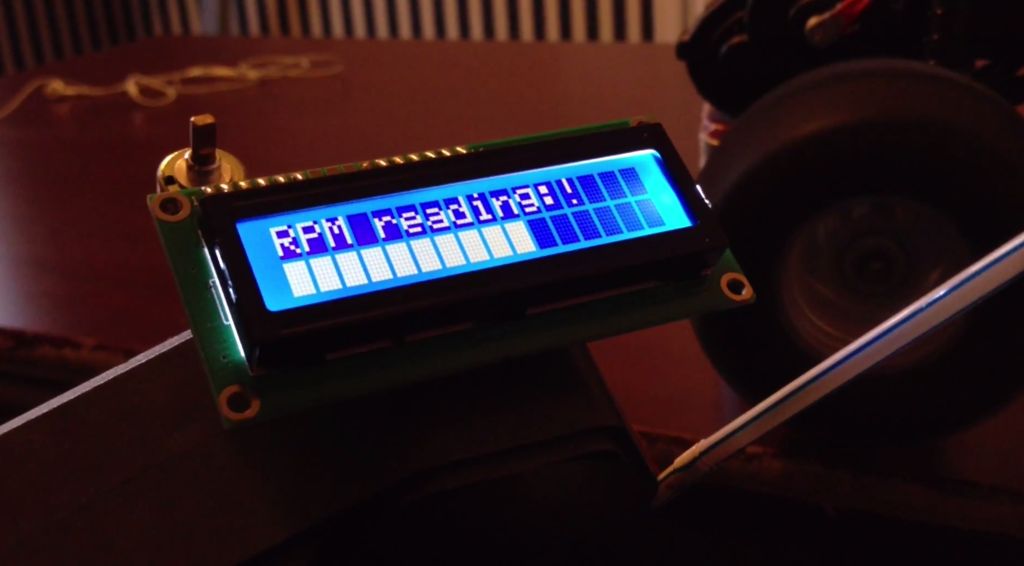
Although I usually use this trick with the Serial Port, Sometimes I also use it with an LCD screen
Step 1: Psuedocode!
print a basic letter, which can be a unit for the graph such as a lowercase L, l;however, we want to print this letter repeatedly to emulate a graph.
Pseudocode:
//Gather Sensor Data;
for(int i = 0; i < (The value you want to graph); i++) {
//print the letter you chose, such as “l”;
// but print it all on the same line;
}
// now go to the next line in the Serial Monitor
Step 2: Basic Example for Arduino
Here’s an example to graph an analog sensor, such as a potentiometer. The analog pin is A0 for these examples.
void setup() {
Numéro de série.begin(9600);
}
void loop() {
// Analog Sensor Connected to analog pin 0
int SensorVal = analogRead(A0);
for(int i = 0; i < SensorVal; i++) {
Serial.print(“l”);
}
Serial.println();
delay(50);
}
Try it, you know you want to!
When you do try it, you’ll notice that the graph is sideways, and the bottom of the Serial Monitor shows the most recent reading of the Sensor.
You’ll also notice that the graph can get quite long, and may be wrapped around to the next line if the windows isn’t wide enough. To fix this we can use a function called map();
this will take in a minimum and maximum value for your sensor, and then scale it to a desirable output.
Here’s how the code would look like for this example. Note, 1023 is the maximum output value for the analogRead() function. also note, we are scaling the analog read function to a value from 0 to 100. You will need to place this line of code before the for loop in the earlier example.
SensorVal = map(SensorVal, 0, 1023, 0, 100);
Here is the complete code for a scaled graph of an Analog sensor on analog pin 0.
void setup() {
Numéro de série.begin(9600);
}
void loop() {
// Analog Sensor Connected to analog pin 0
int SensorVal = analogRead(A0);
SensorVal = map(SensorVal, 0, 1023, 0, 100);
for(int i = 0; i < SensorVal; i++) {
Serial.print(“l”);
}
Serial.println();
delay(50);
}
For more detail: Graphique des valeurs dans l'Arduino, le Moyen le plus FACILE!