Simple Remote Data Plotting using Android / Arduino / pfodApp
This Instructable shows you how to plot Arduino sensor data on your Android mobile and capture it for later downloading to your computer. These instructions are also avaliable at www.pfod.com.au
No Android programming is required and very little the Arduino programming is needed.
It is an extension of Simple Mobile Data Logging using pfodApp
Step 1: Quick Start Plotting
a) Get an Arduino board and a Bluetooth Module (such as Uno and Bluetooth Shield or FioV3+Bluetooth)
b) Install Arduino IDE
c) Connect the Arduino board (no bluetooth module attached) with a USB cable.
d) Copy this sketch into the Arduino IDE and compile and load it into the Arduino board)
e) Attach the Bluetooth Shield module to the Uno (The Bluetooth Shield is pre-configured for 9600baud BUT set the 3V/5V switch to 5V and set the To Board/To FT232 switch to the To Board position.
f) Load your Android Mobile with pfodApp .
g) Set up a connection between your mobile and the Bluetooth module as described in pfodAppForAndroidGettingStarted.pdf
h) Start the pfodApp and connect to your Arduino board via the Bluetooth module.
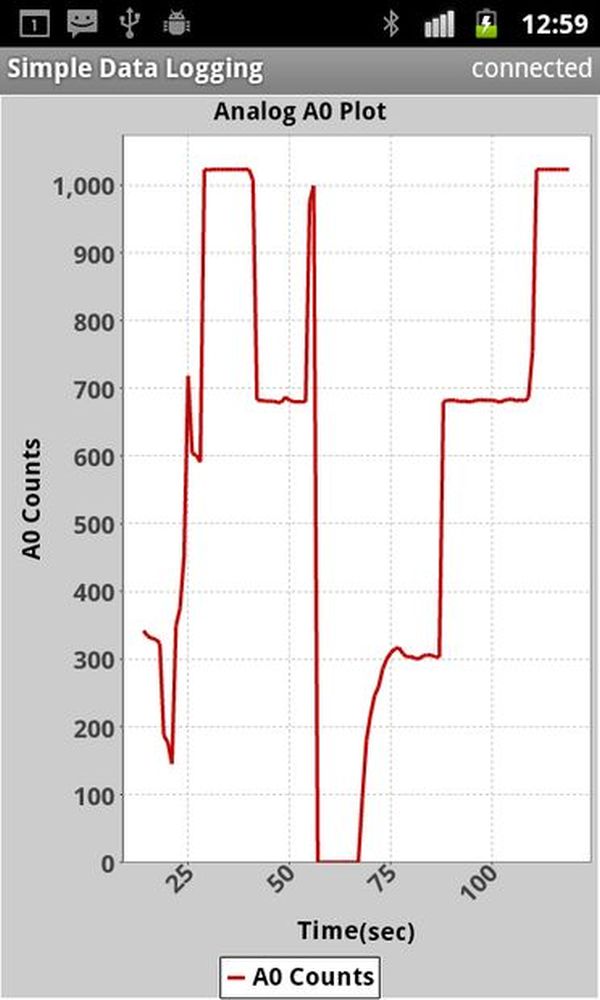
i) Finished. Your mobile will now be saving and plotting the Arduino AtoD converter counts for input A0
Step 2: The Plotting Sketch
Plotting using pfodApp requires two things:-
a) a stream of data (in CSV format) and
b) a plot command from the pfodDevice (Arduino)
The sketch, SimpleDataPlotting.ino, only does two things.
First it reads the A0 analog input once a second and sends out the current seconds and the counts in CSV format,
Second when the pfodApp connects and requests the main menu, the sketch responds with the plotting command to start plotting the measurements.
Here is the code that is executed once a sec to read the A0 analog input and write the current seconds , counts out to the bluetooth connection.
// read A0 once a sec
int val = analogRead(0); // A0
// output the current time and reading in csv format
Serial.print(thisMillis/1000); // first field is time in secs
Serial.print(“,”); // comma separates fields
Serial.println(val); // new line terminates data record
Here is the code that responds to the pfodApp request for the pfodDevice’s (Arduino Uno’s) main menu.
byte in = 0;
if (Serial.available()) {
in = Serial.read();
byte cmd = parse(in);
if (cmd != 0) { // have parsed a complete msg { to }
if (cmd == (byte)’.’) { // pfodApp has asked for main menu
// send back open plotting screen
Serial.println(F(“{=Analog A0 Plot|Time(sec)|A0 Counts}”)); // this is the main menu
} else {
// this should never happen
Serial.println(“Unknown cmd”);
Serial.println(“{}”); // always respond with something in this case an empty msg
}
cmd = 0; // have processed this cmd now
// so clear it and wait for next one
}
}
When your mobile’s pfodApp connects it automatically asks for the main menu (by sending the {.} message), the parser in the sketch (see the code at the bottom of the sketch) parses the {.} and returns the ‘.‘ command. The sketch then sends back a plot command
{=Analog A0 Plot|Time(sec)|A0 Counts}
That command instructs the pfodApp to open a screen called “Analog A0 Plot” and plot the time against the counts. The pfodApp then scans the raw data coming in and looks for lines with two fields and takes the first field as the x value and the second as the y value and adds that point to the plot.
Whenever a plotting screen (or a raw data screen) is opened, the pfodApp starts saving all the raw data to a local file on your mobile. The pfodApp continues to save the data until you exit the pfodApp. You can download this file to your computer for further processing (see one of the later steps).
There a number of other options to the plot command which allow you to ignore some fields, set plot scales, plot multiple plots on one chart etc. See the pfodSpecification for details and examples.
The pfodApp can do much more then just plotting, see these examples.
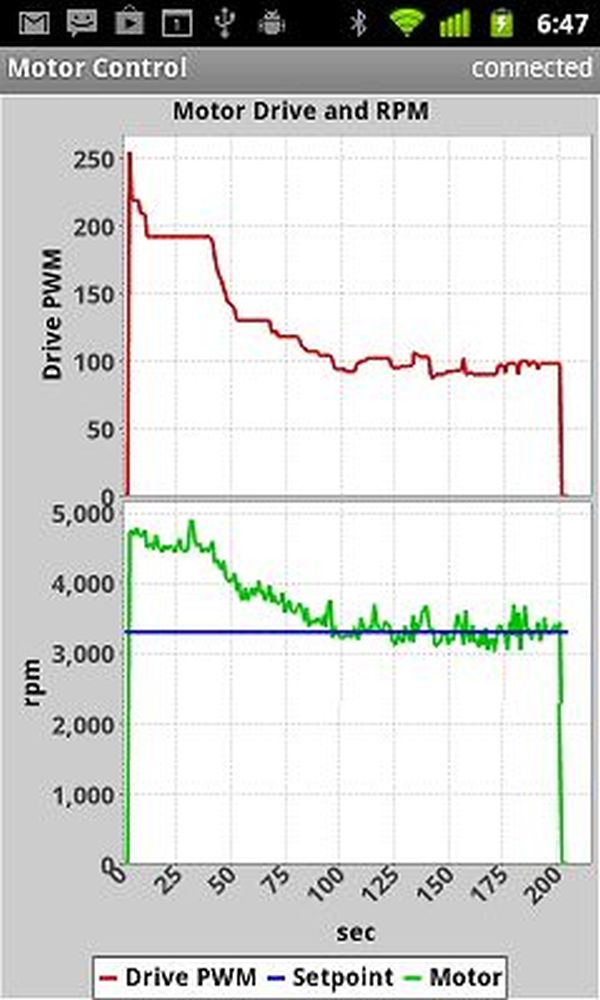
The plot above is an example of two charts one of which has two plots on it. This plot is from ArduMower Do it yourself robotic mower! which uses the same pfodApp to control a robotic mower. The same pfodApp is used to control all the pfodDevices. It is the pfodDevices that completely determine what screens are displayed to the users.
Step 3: More Detail
The latest version of pfodApp available from the Android Market enables raw data sent by a pfodDevice (e.g. Arduino) to be plotted and saved to a file for later use. See the pfodAppForAndroidGettingStarted.pdf for how to download the file from your Android mobile to your computer.
Plotting requires two things:-
a) a stream of data (in CSV format) and
b) a plot command from the pfodDevice
Your pfodDevice (Arduino) can send any type of data outside pfod messages. pfod messages which are enclosed by { } which distinguishes them from other data.
If you want to plot data you need to send the data in CSV format. That is data values separated by commas , and terminated by a newline (either CR or LF or CR LF)
For example
105,680
When the pfodDevice wants to display a plot to the user, the pfodDevice sends a plot command. Your Arduino sketch is in complete control of what pfodApp plots. The plot command gives a title to the plot screen and specifies which stream of raw data to plot and which fields from that stream. Different streams of raw data have different numbers of comma separated fields. The number of bars | in the plot command must match the number of fields in the data stream you want to plot. Data lines with a different number of fields are ignore for this plot.
There are a number of options for the plotting command to select the fields to plot and to set scales and units and to put multiple plots on the one chart. The simplest is to send the x values as the first field and the y values as the following fields, then in the plotting command name the x-axis and y-axis e.g.
{=Analog A0 Plot | Time(sec) | A0 Counts }
plot title | x values field | y values field
You can also view the raw data being sent to your mobile. The “Raw Data” screen can be accessed from pfodApp using your mobile’s menu or it can be opened by the pfodDevice sending a streamingRawData message, {=Title Of the Screen Goes Here} i.e a truncated version of the plotting command.
Either way the pfodApp raw data screen is opened and will display the data that has been sent from the pfodDevice. When the screen is opened, pfodApp will start to save the data to a file. The name of the file is displayed each time the screen (or a plotting screen) is opened.
To prevent your mobile filling up with data you did not want, pfodApp does not start writing data to the mobile’s SD card until the first time the Raw Data screen or plotting screen is opened after a each new connection. The first time the Raw Data screen is opened after a new connection, up to 4K bytes of previously received data (since the connection was made) is written to file when it is opened. This data is also available for the plot. In most cases this means all the raw data sent since the connection was made will be saved. When the connection is closed, the last of the data is written and the file is closed.
If the file already exists, from a previous connection, it is appended to by each subsequent connection. You can download and delete the file from your computer. See the pfodAppForAndroidGettingStarted.pdf for how to access the file from your computer.
For more detail: Simple Remote Data Plotting using Android / Arduino / pfodApp