This page and linked pages detailed below document how to build whole house energy monitor that has a display for easy, quick access to current energy use information, usb datalogging for detailed long term data storage and Internet connectivity for online graphing.
First a quick look at the installed setup:
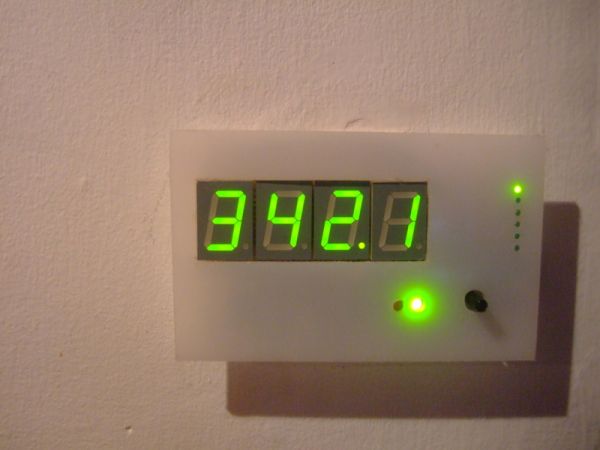
The Display
The display unit consisting of 4 large green led 7 segments. On the right is a 6 mode – mode chooser so that you can select by turning the potentiometer (bottom – right) whether the display shows real power, apparent power, power factor, RMS Voltage, RMS Current, frequency or cumulative kWh used. The display is connected to the main unit by a cable that goes through the wall at the back of the display.
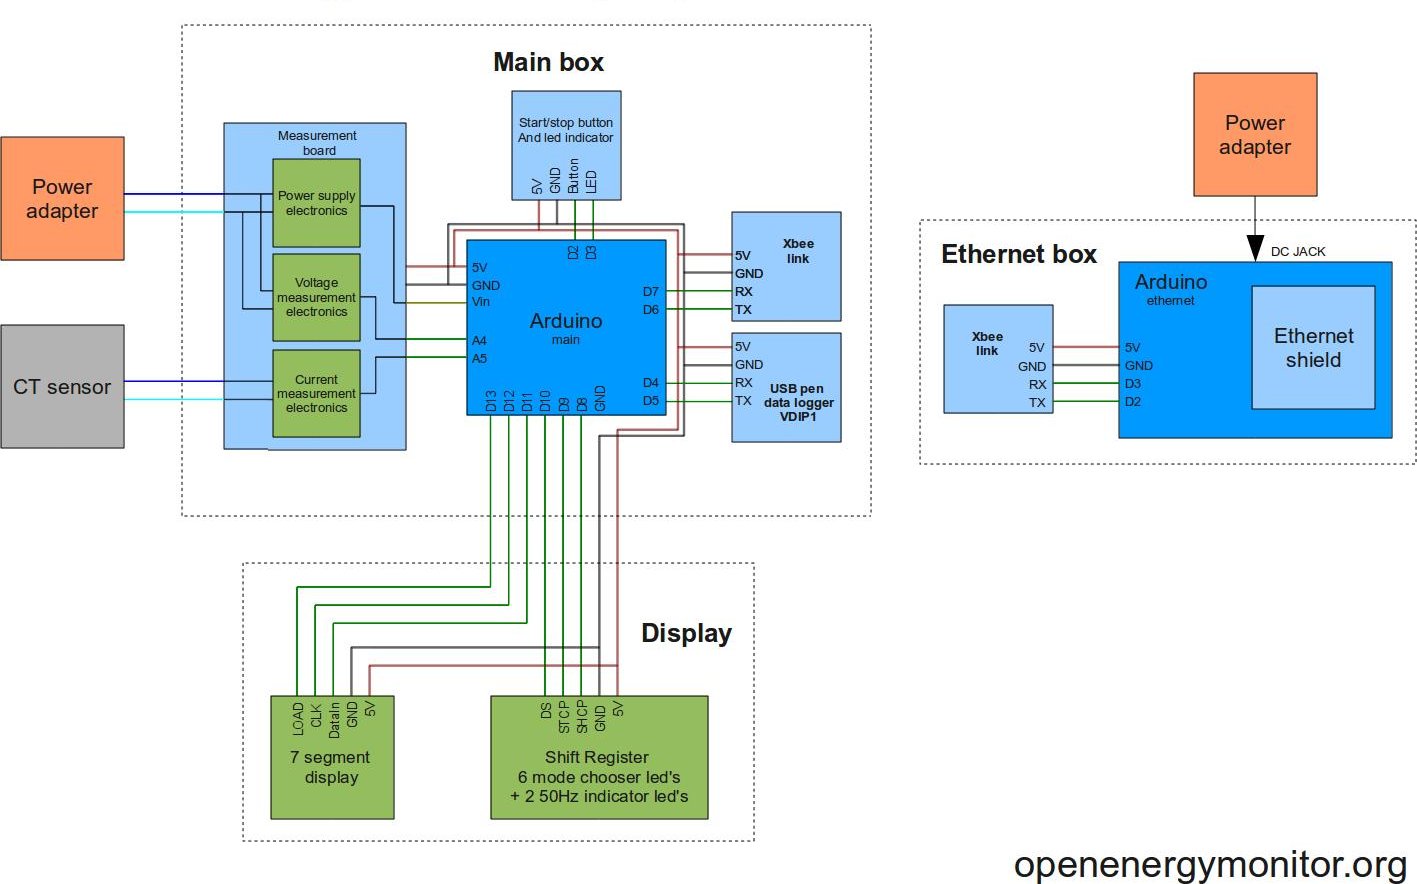
The Main unit
The main unit is the small box in the far left of pic below with the white CT sensor wire crossing the shelf over to the sensor clipped on to the main mains wire on the right. The main unit contains the Arduino, voltage and current measurement electronics, power electronics, usb pen datalogging and xbee wireless link.
The Ethernet unit
The ethernet unit is connected to the router, the small box on top of the larger box houses the wireless xbee link.
Web based graphing
Below is a screenshot of the web based graphing that can be seen live here.
Graphing is done using flot – a very nice piece of software.
For more pictures of the setup check out the picasa album here.
Main Features:
- Voltage measurement with step down AC to AC adapter
- Current measurement with CT sensor.
- Power for sensor board provided with same AC to AC adapter used for voltage measurement.
- Calculation of Real power, Apparent power, power factor, RMS voltage, RMS current, frequency, cumulative kWh.
- Display unit consisting of large green 7 segment display,
- 6 mode – mode chooser and red/green led indicator to indicate when grid is below and above 50Hz.
- USB pen data logging using VDIP1 board
- Xbee wireless link from sensor unit to the Ethernet unit.
- Ethernet board for logging and graphing on Internet.
- Flot based graphing on website.
[box color=”#985D00″ bg=”#FFF8CB” font=”verdana” fontsize=”14 ” radius=”20 ” border=”#985D12″ float=”right” head=”Major Components in Project” headbg=”#FFEB70″ headcolor=”#985D00″]
Here’s the full part list, it contains links to suppliers (mainly farnell), part prices and alternative parts to try to bring the cost down.
Quick cost breakdown
Measurement Board: £12.68
Xbee link: £54.32
Xbee link cable: £0.57
DataLogger: £15.44
Display: £19.56
Display cable: £1.53
Ethernet shield: £29.00
2 Arduino’s: £41.16
Total: £174.25!!!
[/box]
For more detail: How to build a whole home energy monitor using Arduino