Instantaneous Voltage and current
AC Voltage and current continually alternate, as the name suggests, if we draw a picture of the voltage and current waveform over time, it will look something like the image below (depending on what’s using power – the current waveform – blue in the diagram below – is what you get if you look at a typical laptop power supply. There’s an incandescent light bulb in there as well).
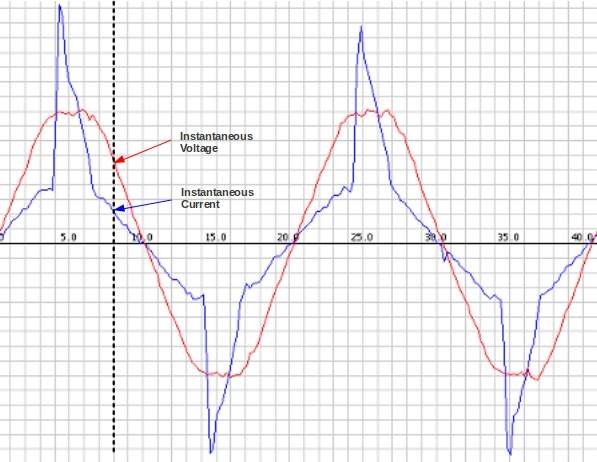 The image was made by sampling the mains voltage and current at high frequency, which is exactly what we do on the emontx or Arduino. We make between 50 and a 100 measurements every 20 milliseconds. (100 if sampling only current, and 50, if sampling voltage and current – we’re limited by the Arduino analog read command and calculation speed).
Calculating real power
Real power is the average of instantaneous power. The calculation is relatively straightforward on the Arduino.
First we calculate the instantaneous power by multiplying the instantaneous voltage measurement with the instantaneous current measurement. We sum this instantaneous power measurement over a given number of samples and divide by that number of samples:
for (n=0; n<number_of_samples; n++)
{
  // inst_voltage and inst_current calculation from raw ADC input goes here

  inst_power = inst_voltage * inst_current;

  sum_inst_power += inst_power;
}

real_power = sum_inst_power / number_of_samples;
Root-Mean-Square (RMS) Voltage
The root-mean-square is calculated in the way the name suggests first we square the quantity, then we calculate the mean and finaly the square-root of the mean-square,
For more detail: AC Power Theory – Arduino maths