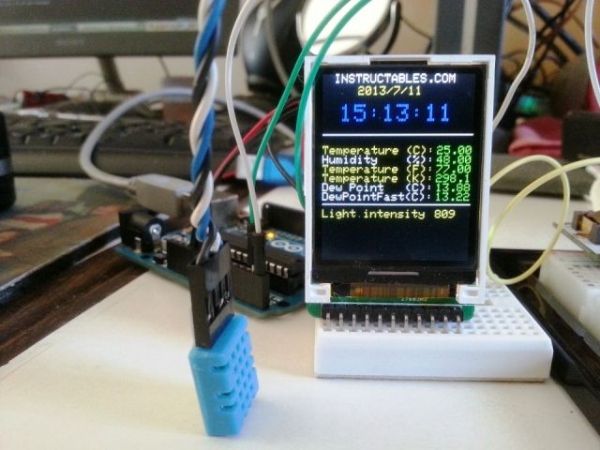
This is an Example of how you can use the Arduino to monitor various environmental parameters And display them on a LCD screen.
 Note: I Added a Real Time Clock!! To see the steps, added parts and Sketch I added new steps..
Step 1: Parts List
[box color=”#985D00″ bg=”#FFF8CB” font=”verdana” fontsize=”14 ” radius=”20 ” border=”#985D12″ float=”right” head=”Major Components in Project” headbg=”#FFEB70″ headcolor=”#985D00″]
Arduino uno R3 or compatible 30.00
Sainsmart “1.8” TFT Color LCD Display 18.50
DHT11 Digital Temperature and Humidity Sensor 6.44
Mini Breadboard 5.00
Jumper Wire
[/box]
Step 2: Connect display to Arduino.
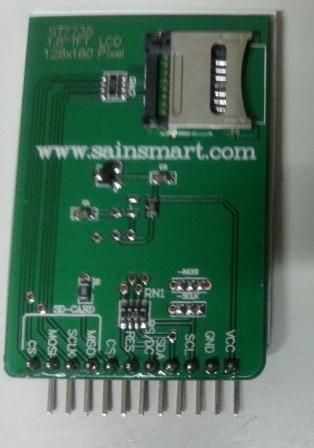
I used the mini breadboard to connect the display to the Arduino.
Use jumper wires to connect from the Arduino pins to the breadboard in the following order:
Arduino: 5v TFT DISPLAY VCC
gnd GND
Digital 4 SCL
5 SDA
6 CS
7 DC
8 RES
Step 3: Test the display
In order to test the display, you will need to download and install two libraries into your Arduino IDE. Although the display is sold by Sainsmart, I had trouble using their libraries and downloaded the libraries from ADAFRUIT, who sells a similar display and has much better documentation and support..I’d normally feel a little guilty about ordering these from SainSmart and using the Adafruit instructions and libraries, but I purchase enough other stuff from Adafruit to appease my conscience. If you end up taking the same route I did, I encourage you to at least look at the other stuff they offer.
Two libraries need to be downloaded and installed: The first is the ST7735 library (which contains the low-level code specific to this device). The second is the Adafruit GFX Library (which handles graphics operations common to many displays that Adafruit sells). Download both ZIP files, uncompress and rename the folders to ‘Adafruit_ST7735’ and ‘Adafruit_GFX’ respectively, place them inside your Arduino libraries folder and restart the Arduino IDE.
You should now be able to see the library and examples in select File > Examples > Adafruit_ST7735 > graphicstest sketch. load the sketch to your Arduino.
If you were successful at installing the libraries, and loading the graficstest sketch, Click on the verify button to compile the sketch and make sure there are no errors.
It’s time to connect your Arduino to your PC using the USB cable, and click on the upload button to upload the sketch to the Arduino.
Once uploaded, the Arduino should perform all the test display procedures! If you’re not seeing anything – check to see if the back-light is on, if the back-light is not lit, something is wrong with the Power wiring. If the back-light is lit ,but you see nothing on the display recheck the digital signals wiring.
If everything is working as expected, we are ready to wire up the DHT sensor.
Step 4: Connect the DHT11 sensor to the Arduino
As with the display, I used jumper wires to connect the required power and data pins for the DHT11 using the mini Breadboard. Line up the pins and then plug in the sensor.
Looking at the front of the sensor:
From Left to Right
connect pin 1 of DHT11 to 5 V, Pin 2 to Digital Pin 2 of the Arduino, Pin 3 no connection, and Pin 4 to Arduino GND.
That’s It!
Step 5: Test the DHT11 sensor
You need to download another Library to get the Arduino to talk with the DHT11 sensor. The sensor I got didn’t come with any documentation, so I Googled around until I found a library that works.
I found it in the Virtualbotix website
As with the display libraries, Download the library unzip it, and install it in the Arduino IDE. Place it inside your Arduino libraries folder , rename it DHT11, and restart the Arduino IDE.
You should now be able to see the library and examples in select File > Examples > DHT11 > dht11_functions sketch.
oad the sketch to your Arduino.
If you were successful at installing the libraries, and loading the dht11_functions sketch, Compile the sketch by clicking on the verify button and make sure there are no errors.
It’s time to connect your Arduino to your PC using the USB cable. Click on the upload button to upload the sketch to the Arduino.
Once uploaded to the Arduino, open the serial monitor, and you should see the data stream with information coming from the sensor.
If you got the sensor working, we’re now ready to display the data on the TFT Screen..
Step 6: Final step, Displaying Sensor Data on the TFT
// copy the sketch below and paste it into the Arduino IDE compile and run the program.
// this sketch was created using code from both the adafruit and the virtuabotix sample sketches
// You can use any (4 or) 5 pins
#define sclk 4
#define mosi 5
#define cs 6
#define dc 7
#define rst 8 // you can also connect this to the Arduino reset
#define ANALOG_IN 0 // for cds light sensor
#include <Adafruit_GFX.h> // Core graphics library
#include <Adafruit_ST7735.h> // Hardware-specific library
#include <SPI.h>
#include <dht11.h> // dht temp humidity sensor library
dht11 DHT11;
Adafruit_ST7735 tft = Adafruit_ST7735(cs, dc, mosi, sclk, rst);
void setup(void) {
DHT11.attach(2); // set digital port 2 to sense dht input
Serial.begin(9600);
Serial.print(“hello!”);
tft.initR(INITR_BLACKTAB); // initialize a ST7735S chip, black tab
Serial.println(“init”);
//tft.setRotation(tft.getRotation()+1); //uncomment to rotate display
// get time to display “sensor up time”
uint16_t time = millis();
tft.fillScreen(ST7735_BLACK);
time = millis() – time;
Serial.println(time, DEC);
delay(500);
Serial.println(“done”);
delay(1000);
tftPrintTest();
delay(500);
tft.fillScreen(ST7735_BLACK);
// Splash screen for esthetic purposes only
// optimized lines
testfastlines(ST7735_RED, ST7735_BLUE);
delay(500);
testdrawrects(ST7735_GREEN);
delay(500);
tft.fillScreen(ST7735_BLACK);
}
void loop() {
// tft.invertDisplay(true);
// delay(500);
// tft.invertDisplay(false);
tft.setTextColor(ST7735_WHITE);
tft.setCursor(0,0);
tft.println(“Sketch has been”);
tft.println(“running for: “);
tft.setCursor(50, 20);
tft.setTextSize(2);
tft.setTextColor(ST7735_BLUE);
tft.print(millis() / 1000);
tft.setTextSize(1);
tft.setCursor(40, 40);
tft.setTextColor(ST7735_WHITE);
tft.println(“seconds”);
tft.setCursor(0, 60);
tft.drawLine(0, 50, tft.width()-1, 50, ST7735_WHITE); //draw line separator
tft.setTextColor(ST7735_YELLOW);
tft.print(“Temperature (C): “);
tft.setTextColor(ST7735_GREEN);
tft.println((float)DHT11.temperature,1);
tft.setTextColor(ST7735_WHITE);
tft.print(“Humidity (%): “);
tft.setTextColor(ST7735_RED);
tft.println((float)DHT11.humidity,1);
tft.setTextColor(ST7735_YELLOW);
tft.print(“Temperature (F): “);
tft.setTextColor(ST7735_GREEN);
tft.println(DHT11.fahrenheit(), 1);
tft.setTextColor(ST7735_YELLOW);
tft.print(“Temperature (K): “);
// tft.print(” “);
tft.setTextColor(ST7735_GREEN);
tft.println(DHT11.kelvin(), 1);
tft.setTextColor(ST7735_WHITE);
tft.print(“Dew Point (C): “);
tft.setTextColor(ST7735_RED);
tft.println(DHT11.dewPoint(), 1);
tft.setTextColor(ST7735_WHITE);
tft.print(“DewPointFast(C): “);
tft.setTextColor(ST7735_RED);
tft.println(DHT11.dewPointFast(), 1);
tft.drawLine(0, 110, tft.width()-1, 110, ST7735_WHITE);
tft.setCursor(0,115);
tft.print(“Light intensity “);
int val = analogRead(ANALOG_IN);
tft.setCursor(60, 130);
tft.setTextColor(ST7735_YELLOW);
tft.println(val, 1);
delay(2000);
tft.fillScreen(ST7735_BLACK);
}
void tftPrintTest() {
tft.setTextWrap(false);
tft.fillScreen(ST7735_BLACK);
tft.setCursor(0, 60);
tft.setTextColor(ST7735_RED);
tft.setTextSize(2);
tft.println(“temperature”);
tft.setTextColor(ST7735_YELLOW);
tft.setTextSize(2);
tft.println(“humidity”);
tft.setTextColor(ST7735_GREEN);
tft.setTextSize(2);
tft.println(“monitor”);
tft.setTextColor(ST7735_BLUE);
//tft.setTextSize(3);
//tft.print(3598865);
delay(500);
}
void testfastlines(uint16_t color1, uint16_t color2) {
tft.fillScreen(ST7735_BLACK);
for (int16_t y=0; y < tft.height(); y+=5) {
tft.drawFastHLine(0, y, tft.width(), color1);
}
for (int16_t x=0; x < tft.width(); x+=5) {
tft.drawFastVLine(x, 0, tft.height(), color2);
}
}
void testdrawrects(uint16_t color) {
tft.fillScreen(ST7735_BLACK);
for (int16_t x=0; x < tft.width(); x+=6) {
tft.drawRect(tft.width()/2 -x/2, tft.height()/2 -x/2 , x, x, color);
}
}
Step 7: Bonus ! A light sensor using analog input
As an Added bonus, you can monitor any analog signal using one of the Arduino analog inputs. As an example , I will use a CDS photo resistor to monitor Light intensity.
You Wil need:
1 CDS photo-resistor
1 10 K ohm resistor
Steps:
Connect the resistor and CDS photocell in series in an unused space in the mini breadboard.
Connect the open leg of the photocell to the +5v
Connect the open leg of the resistor to GND
Connect the CDS Resistor Junction to the Analog input 0 of the Arduino (the code to monitor the input is already in the sample sketch)
You’re done!!
You can monitor virtually any analog parameter using this input method: i.e Sound level, wind speed, vibration etc…
For more detail: Mini Arduino environment monitor ** UPDATE – Added RTC ***