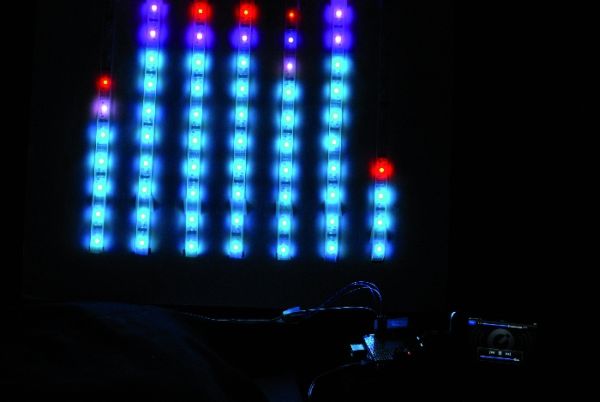
Let’s put together a pixel strip with an HL1606, an Arduino UNO and the Spectrum Shield to build a seven bands “large” Spectrum Analyzer of simple construction.
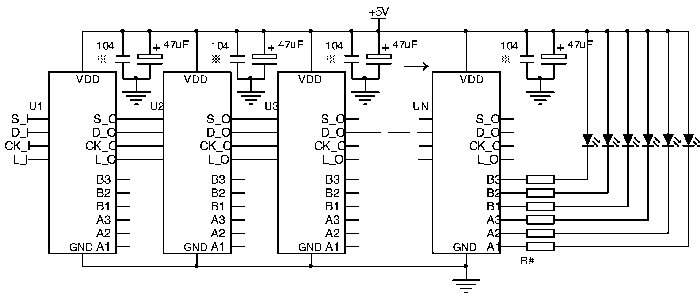
The Strip used uses the HL1606 controller to allow direct management of each of the LEDs. The chip runs two RGB groups and has 4-pin for input/output. The serial communication protocol allows input to output passage whenever the chip receives new data. Data move from one module to another thanks to a clock provided on the control line. Every strip can be composed of a variable number of modules up to a theoretical maximum determined only by the speed with which we want to change the LEDs status.
Each chip continues in the pass through without displaying received data, until the latch pin (L-s) status changes . Then it writes the value from it’s communication registry in registry piloting the six channels.
For the HL1606, data is a bitmap (a one byte word for each RGB LEDS) corresponding to each of the three LEDs, managed according to a truth table having two bits for each LED. The chip does not have autonomous blending management (PWM), but it uses a SI line to give the automatic blending frequency, which is available as a stand-alone function.
The second key component of this project is a MSGEQ7 chip. The chip is designed for seven-band equalizers, for displaying the peak level of each of the bands. With just eight pins it has a “clever” mechanism: this chip offers, on a single pin, a voltage level that is equal to the peak level of one of the seven frequencies managed.
The transition from one frequency to another is managed via a strobe pin, which increments a multiplexer including all seven Bandpass Filters with peak detectors.
Basically, on the same pin on can be read a sequence the seven peak levels for the seven bands centered on 63, 160, 400, 1,000, 2,500, 6,250 and 16,000 Hz.
If we add an Arduino UNO, we have everything we need to read the seven values on different frequency bands, and create a representation of the same on a series of bars, in fact our giant Spectrum analyzer.
Creating seven bands without cutting the led strip
The flexible nature of the strip we’ve chosen allows us to model it as we prefer: in our case, we get seven bands bars simply by folding the strip to form a coil. Between a bar and the other we’ll leave three LEDs (to avoid excessive stress on the Strip).
The height of the bar depends on the total length; firmware adjusts it, using only the LEDs needed. In our case we are using a standard 5 meters strip and 160 LED: we will therefore have six curves by three LEDs (18 LEDs are not used) to have seven 20 LED bars each. Two diodes remain unused at the end of the Strip, that is considered in counts.
With this arrangement, even bars work in a verse and odd ones in another: this is managed by the firmware.
The Spectrum Shield
The peculiar MSGEQ7 chip has attracted the attention of several companies. Bliptronics and Sparkfun, have therefore carried out a Spectrum Shield: a shield for Arduino, mounting two chips and two stereo jacks: one for receiving the input signal and another for the pass through output.
The two MSGEQ7 handle the stereo signal channels, read from the analog A0 and A1 pin by the Arduino. The Reset and the Strobe of MSGEQ7 are, respectively, connected to D5 and D4 of Arduino.
The shield has a button to reset the Arduino connected through lateral connectors, while a large Breadboard area allows you to add any accessory components.
You don’t need a library specific for this shield: acting on Reset and Strobe you have the sequence of levels on Arduino analog inputs in an endless loop. A cycle that feeds a seven values vector you can then pass the data to the graphic representation.
For more detail: Big Spectrum Analyzer with Arduino